PSYCHOLOGY WIZARD
  • Home
  • Unit 1 FOUNDATIONS
    • Biological >
      • Adoption & Twin Studies AO1 AO2 AO3 >
        • Gottesman & Shields AO1 AO3
        • Kety AO1 AO3
      • Aggression AO1 AO2 AO3 >
        • Evolutionary Psychology AO1 AO2 AO3
      • The Brain AO1 AO2 >
        • Drugs & the Brain AO1 AO2 AO3
      • Brendgen AO1 AO3
      • Development (Maturation) AO1 AO2 AO3
      • Freud's Psychodynamic Theory AO1 AO3 >
        • Aggression & Freud AO1 AO2 AO3
        • Development & Freud AO1 AO2 AO3
        • Individual Differences & Freud AO1 AO2 AO3
      • Raine AO1 AO3
      • Biological Key Question AO1 AO2
    • Cognitive >
      • Baddeley AO1 AO3
      • Multi Store Model AO1 AO2 AO3
      • Reconstructive Memory AO1 AO2 AO3
      • Schmolck AO1 AO3
      • Tulving's Long Term Memory AO1 AO2 AO3
      • Working Memory AO1 AO2 AO3
      • Cognitive Key Question AO1 AO2
    • Learning >
      • Bandura AO1 >
        • Bandura AO3
      • Becker AO1 AO3
      • Classical Conditioning AO1 AO2 AO3
      • Operant Conditioning AO1 AO2 AO3
      • Pavlov AO1 AO3
      • Social Learning AO1 AO2 AO3
      • Therapies for Phobias >
        • Flooding
        • Systematic Desensitisation
      • Watson & Rayner AO1 AO3
      • Learning Key Question AO1 AO2
    • Social >
      • Agency Theory AO1 AO2 AO3
      • Burger AO1 AO3
      • Situational Factors AO1 AO2 AO3
      • Milgram AO1 >
        • Milgram AO3
      • Realistic Conflict Theory AO1 AO2 AO3
      • Sherif AO1 >
        • Sherif AO3
      • Social Impact Theory AO1 AO2 AO3
      • Social Identity Theory AO1 AO2 AO3
      • Social Key Question AO1 AO2
  • Unit 2 APPLICATIONS
    • Clinical >
      • Depression AO1 AO2 >
        • Biological Explanation AO1 AO2
        • Non-Biological Explanation AO1 AO2
        • Biological Treatment AO1 AO2
        • Psychological Treatment AO1 AO2
      • Diagnosing Abnormality AO1 AO2 AO3
      • Diagnostic Manuals AO1 AO2 AO3
      • Carlsson AO1 AO3
      • Kroenke AO1 AO3
      • HCPC Guidelines AO1 AO2 AO3
      • Rosenhan AO1 AO3
      • Schizophrenia AO1 AO2 >
        • Biological Explanation AO1 AO2
        • Non-biological Explanation AO1 AO2
        • Biological Treatments AO1 AO2
        • Psychological Treatment AO1 AO2
      • Clinical Key Question AO1 AO2
      • Issues & Debates >
        • Social Control AO2 AO3
  • Evaluation
    • Ethics AO1 AO2 AO3
    • Individual Differences AO1 AO2 AO3 >
      • Brain Differences AO1 AO2 AO3 >
        • Personality AO1 AO2 AO3
      • Mental Health Differences AO1 AO2 AO3
      • Differences in Obedience & Prejudice AO1 AO2 AO3
      • Memory Differences AO1 AO2 AO3 >
        • Loftus study AO1 AO2 AO3
    • Nature vs Nurture AO1 AO2 AO3
    • Scientific Status AO1 AO2
  • Methods
    • Animal Studies AO1 AO2 AO3
    • Case Studies AO1 AO2 AO3 >
      • Bradshaw AO1 AO3
      • Scoville & Milner AO1 AO3
    • Content Analyses AO1 AO2 AO3
    • Experimental Method AO1 AO2 AO3
    • Experimental Variables AO1 AO2
    • Hypotheses AO1 AO2
    • Inferential Statistics AO1 AO2 >
      • Chi-Squared Test AO1 AO2
      • Mann-Whitney U Test AO1 AO2
      • Spearman's Rho AO1 AO2
      • Wilcoxon Test AO1 AO2
    • Longitudinal Design AO1 AO2 AO3
    • Quantitative Data & Analysis AO1 AO2 AO3
    • Research Design AO1 AO2 AO3
    • Sampling AO1 AO2 AO3
    • Self Report Method AO1 AO2 AO3 >
      • Brown et al. AO1 AO3
  • Blog
  • Contact
  • Resources
Picture

WHAT IS THE CHI-SQUARED TEST?

This is an inferential test created by Karl Pearson (left). It is used when:

  • You have a test of difference (experiment) with independent groups design
  • The data is only nominal level
 
(* it’s possible to turn interval/ratio level data into ordinal data: you just put the scores into a frequency table)
 
The Edexcel exam might ask you about the appropriateness of the Chi-Squared test – when you would use it. But you could be asked to calculate the test. The equation and tables are provided at the front of the exam booklet.

If you are using a interval/ratio data, use one of the other inferential tests instead.

Picture

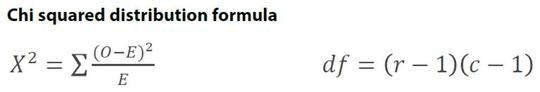
MAKING THE CALCULATIONS

Of course, most researchers use computers to do their statistical tests. There are lots of websites that will let you input your data from an experiment and carry out the Chi-Squared test for you.
Calculate Chi-Squared test here
The Exam expects you to be able to work out the Chi-Squared test "by hand" and, although it's fiddly, it's not that difficult. However, it would be best to bring a calculator!

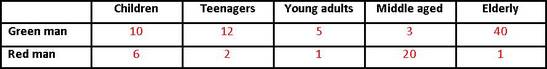
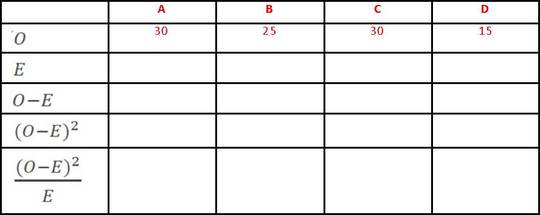
There are two formulae up above and they look pretty simple, but they take a while to do. The simplest way is to draw some tables (and if this question comes up in the Exam, the question paper will probably draw the table for you to fill in).
 
You are trying to work out the value of Chi-Squared (X2) and to do this you need to calculate O (the frequencies you observed) and E (the frequencies you expected to observe). Let’s imagine the results of a survey to find out how many men and women own smartphones.
 
O is easy enough. Imagine you have researched whether women are more likely to own a smartphone than men. Draw a table of your observed frequencies.
Picture
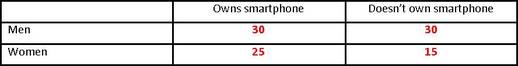
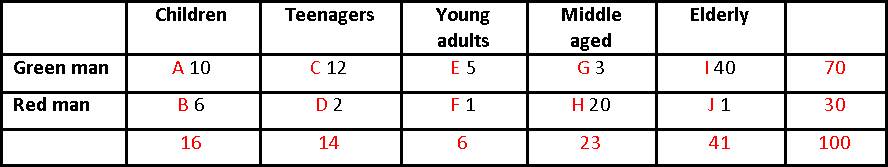
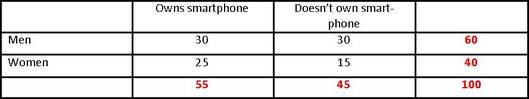
To work out E, you need to add up your rows and columns.
Picture
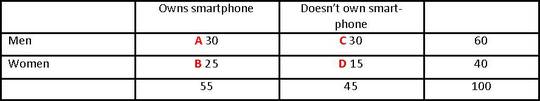
Now you need to label each box in your table going down each column in turn:
Picture
Once this is done, you can create your Chi-Squared table of Expected Frequencies:
Picture
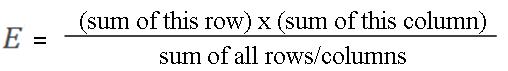
The only tricky thing to work out here is E and if you’re lucky an Exam question will do that for you too. You work out E for each box (A, B, C, etc) like this:
Picture
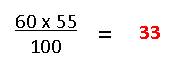
So box A has a row that adds up to (30+30) 60 and a column that adds up to (30+25) 55; the sum of all the rows/columns is 100.
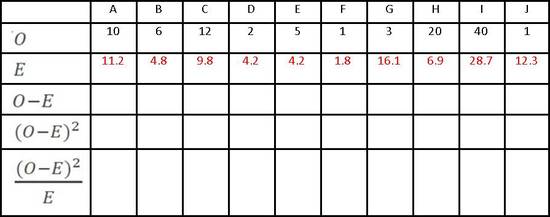
Picture
Here it is in full:
Picture
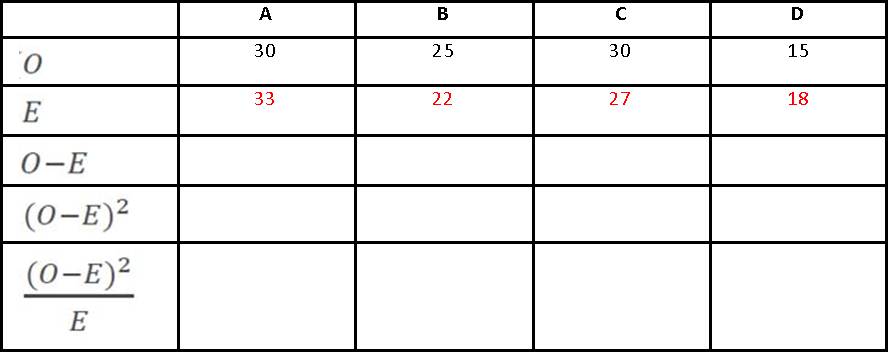
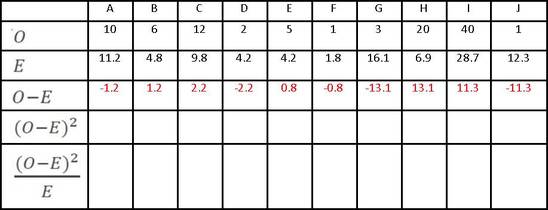
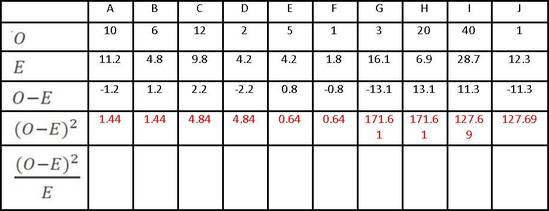
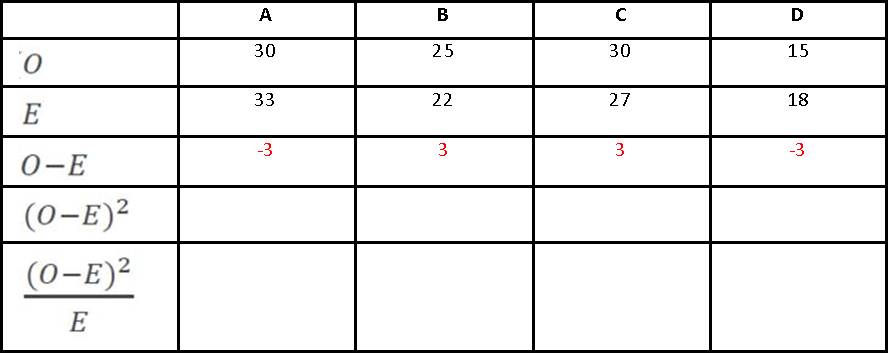
The rest is straightforward. You deduct each value of E from the value of O above it:
Picture
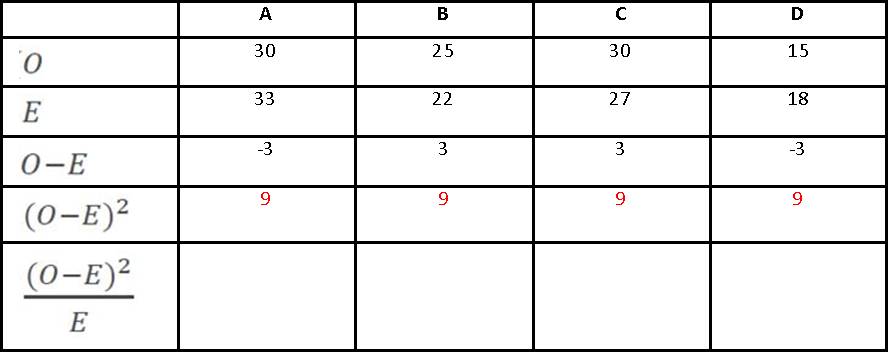
Then you square (multiply by itself) each number you just arrived at:
Picture
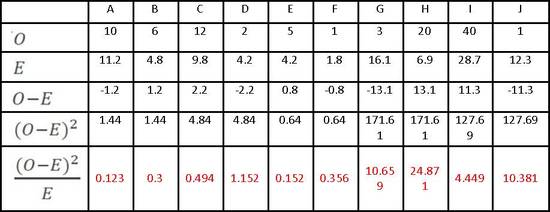
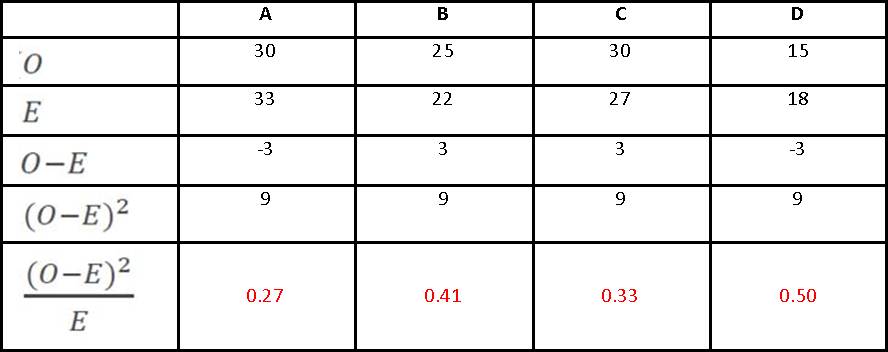
Lastly you divide each number you produced by the value of E up above:
Picture
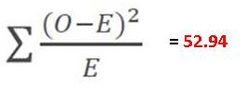
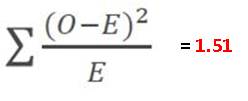
Nearly there. You work out X2 by adding all the numbers in the bottom row together:
Picture
You will compare X2 to the critical value and you are looking for X2 to be lower than the critical value.
 
Before you can look up the critical value, you need to know three things:
  1. Is your experimental hypothesis 1-tailed (directional) or 2-tailed (non-directional)? You look on a different table for each.
  2. What value of probability (p) are you considering? Normally, a classroom experiment would be considered at a value of p≤0.05
  3. What degrees of freedom (df) are you looking at?
 
Degrees of freedom is a number that represents the complexity of your data. You work it out from the second formula given in the Exam Booklet:
Picture
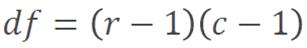
This means taking the number of rows on your original table of frequencies (minus 1) and multiplying it by the number of columns (minus 1). So a simple 2x2 table like the one above is described as “1 degree of freedom”.
 
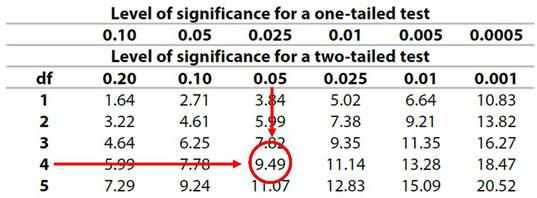
Look at the table of critical values below. If your value of X2 is greater than the critical value, you can refute your null hypothesis (and cautiously accept your hypothesis).
 
If X2 is less than the critical value, you must accept your null hypothesis and refute your experimental hypothesis.
Picture
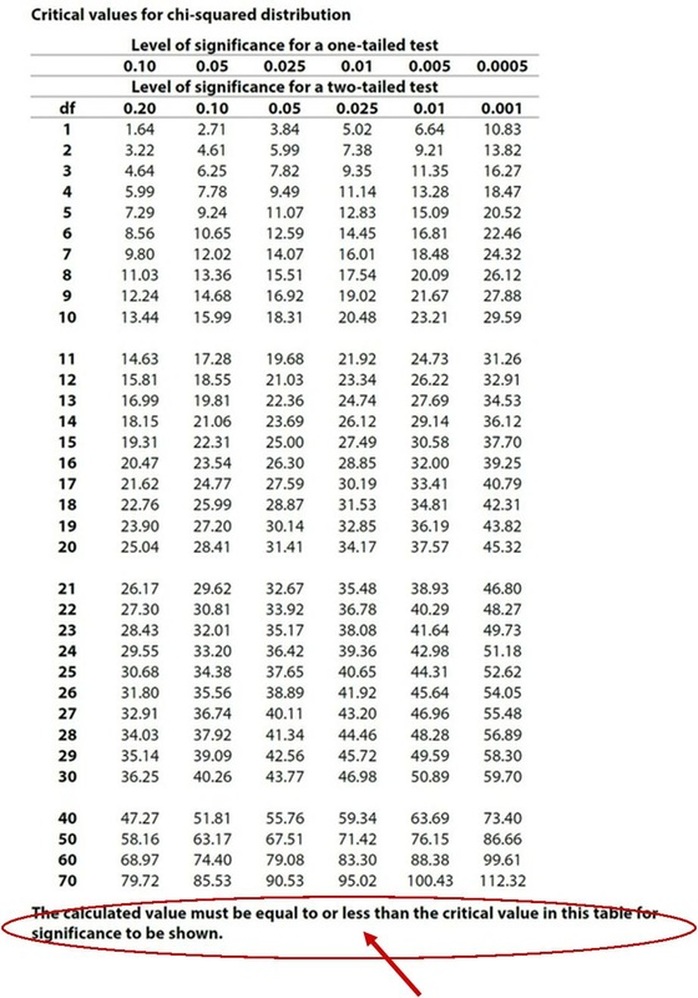
WHAT'S THIS???!!!?!?! Yes, it's a misprint. Edexcel's sample papers all (WRONGLY) say you're looking for X2 to be lower than the critical value. No. You want it to be HIGHER. Hopefully, the Exam Board will correct this in future.

Facepalm!

A STATEMENT OF STATISTICAL SIGNIFICANCE

You can sum up your statistical test with a statement of statistical significance. This will include:

  1. The test used
  2. The observed (X2) and critical values
  3. The direction of the hypothesis
  4. The chosen value of p
  5. The degrees of freedom
  6. The conclusion, in terms of the null hypothesis

For example:

The results were subjected to a Chi-Squared test
The observed value (X2) was 1.5, which is lower than the critical value of 4.6 for a 1-tailed test where p≤0.05 at 1df
Therefore, the null hypothesis can be accepted
Picture
Picture

APPLYING CHI-SQUARED TEST IN PSYCHOLOGY
AO2

One of the studies in Unit 1 that uses the Chi-Squared test is Brendgen et al. (2005).

Brendgen used this test because she was carrying out a test of difference (natural experiment) between two sets of variables – the relationship between teacher- and peer- ratings of aggression in identical (MZ) and non-identical (DZ) twins. Brendgen carried out this test for physical and then for social aggression.

Brendgen collected nominal level data because each classmate chose 3 photos of peers who fitted descriptions of either physical or social aggression, so you either were selected or you weren’t. Although the teacher’s gave each child a score, Brendgen converted this into nominal level data.
 
Similarly, each child was either a MZ or a DZ twin, so this is nominal level data too.

Brendgen was testing a 2-tailed hypothesis at the p≤0.10 level of probability and the results supported her null hypothesis that there wouldn't be any difference between the teacher-ratings and the peer-ratings when it came to either sort of aggression. p≤0.10 is not a very strict level of probability so there was clearly a lot of overlap between the scores.

Becker et al. (2002) also use a Chi-Squared test in their study of how TV influenced Fijian schoolgirls. This was between two independent groups of girls (the 1995 and 1998 cohorts) and whether or not they had a television in their homes. This is nominal level data, because each girl was either in one category or the other.

The 1998 group were significantly more likely to have a TV at home; this was at the p≤0.001 level of probability, so there was only a 1 in 1000 probability this difference between the two groups was down to chance. Another way of putting this is that it is 99.9% likely that this sample is evidence of a wider trend.
Picture

EXEMPLAR CALCULATION
How to DO IT IN THE EXAM

In an observation at a pedestrian crossing, we observed 100 people crossing the road. Some pedestrians crossed the road when the “green man” indicated they should, but some crossed when the “red man” warned them not to. Observers grouped pedestrians based on their apparent age.

  • You need to look for information to work out what's going on. This is definitely a test of difference, because two different sets of scores are being compared (green0man versus red-man crossers). It's nominal level data because each pedestrian is being put into a category rather than being given their own score..

The results are shown below:

Picture
Observed crossing the road...
Calculate whether there is a difference between age groups’ use of the pedestrian crossing using the Chi-Squared test [4 marks]
 
The first thing to do is work out the totals for the columns/rows and label each box.
Picture
Then you create your Chi-Squared table:
Picture
Filling in the rest of the table isn’t too difficult. Subtract E from O:
Picture
Square the result:
Picture
 You ARE allowed to use calculators in the Exam, but if you forget to bring one the multiplication could get time-consuming.
Finally you divide each product by E from the row above:
Picture
You can calculate X2 by adding together all the numbers on the bottom row.
Picture
All we have to do now is compare our observed value to the critical value. With a 2-tailed hypothesis at the p≤0.05 level of probability, we can easily find the critical value so long as we know the degrees of freedom (df). Our original table had 2 rows and 5 columns.
Picture
This gives us (1 x 4) 4df.
Picture
The critical value is 9.49 and our observed value is much higher than that, so the results are statistically significant.
Here's the statement of significance:

The results were subjected to a Chi-Squared test. The observed value of X2 was 52.94. This was higher than the critical value of 9.49, for a 2-tailed test at the p≤0.05 level of probability and 4df. Therefore the null hypothesis can be rejected and the alternative hypothesis is accepted.
Home
Blog
Contact

PSYCHOLOGYWIZARD.NET
  • Home
  • Unit 1 FOUNDATIONS
    • Biological >
      • Adoption & Twin Studies AO1 AO2 AO3 >
        • Gottesman & Shields AO1 AO3
        • Kety AO1 AO3
      • Aggression AO1 AO2 AO3 >
        • Evolutionary Psychology AO1 AO2 AO3
      • The Brain AO1 AO2 >
        • Drugs & the Brain AO1 AO2 AO3
      • Brendgen AO1 AO3
      • Development (Maturation) AO1 AO2 AO3
      • Freud's Psychodynamic Theory AO1 AO3 >
        • Aggression & Freud AO1 AO2 AO3
        • Development & Freud AO1 AO2 AO3
        • Individual Differences & Freud AO1 AO2 AO3
      • Raine AO1 AO3
      • Biological Key Question AO1 AO2
    • Cognitive >
      • Baddeley AO1 AO3
      • Multi Store Model AO1 AO2 AO3
      • Reconstructive Memory AO1 AO2 AO3
      • Schmolck AO1 AO3
      • Tulving's Long Term Memory AO1 AO2 AO3
      • Working Memory AO1 AO2 AO3
      • Cognitive Key Question AO1 AO2
    • Learning >
      • Bandura AO1 >
        • Bandura AO3
      • Becker AO1 AO3
      • Classical Conditioning AO1 AO2 AO3
      • Operant Conditioning AO1 AO2 AO3
      • Pavlov AO1 AO3
      • Social Learning AO1 AO2 AO3
      • Therapies for Phobias >
        • Flooding
        • Systematic Desensitisation
      • Watson & Rayner AO1 AO3
      • Learning Key Question AO1 AO2
    • Social >
      • Agency Theory AO1 AO2 AO3
      • Burger AO1 AO3
      • Situational Factors AO1 AO2 AO3
      • Milgram AO1 >
        • Milgram AO3
      • Realistic Conflict Theory AO1 AO2 AO3
      • Sherif AO1 >
        • Sherif AO3
      • Social Impact Theory AO1 AO2 AO3
      • Social Identity Theory AO1 AO2 AO3
      • Social Key Question AO1 AO2
  • Unit 2 APPLICATIONS
    • Clinical >
      • Depression AO1 AO2 >
        • Biological Explanation AO1 AO2
        • Non-Biological Explanation AO1 AO2
        • Biological Treatment AO1 AO2
        • Psychological Treatment AO1 AO2
      • Diagnosing Abnormality AO1 AO2 AO3
      • Diagnostic Manuals AO1 AO2 AO3
      • Carlsson AO1 AO3
      • Kroenke AO1 AO3
      • HCPC Guidelines AO1 AO2 AO3
      • Rosenhan AO1 AO3
      • Schizophrenia AO1 AO2 >
        • Biological Explanation AO1 AO2
        • Non-biological Explanation AO1 AO2
        • Biological Treatments AO1 AO2
        • Psychological Treatment AO1 AO2
      • Clinical Key Question AO1 AO2
      • Issues & Debates >
        • Social Control AO2 AO3
  • Evaluation
    • Ethics AO1 AO2 AO3
    • Individual Differences AO1 AO2 AO3 >
      • Brain Differences AO1 AO2 AO3 >
        • Personality AO1 AO2 AO3
      • Mental Health Differences AO1 AO2 AO3
      • Differences in Obedience & Prejudice AO1 AO2 AO3
      • Memory Differences AO1 AO2 AO3 >
        • Loftus study AO1 AO2 AO3
    • Nature vs Nurture AO1 AO2 AO3
    • Scientific Status AO1 AO2
  • Methods
    • Animal Studies AO1 AO2 AO3
    • Case Studies AO1 AO2 AO3 >
      • Bradshaw AO1 AO3
      • Scoville & Milner AO1 AO3
    • Content Analyses AO1 AO2 AO3
    • Experimental Method AO1 AO2 AO3
    • Experimental Variables AO1 AO2
    • Hypotheses AO1 AO2
    • Inferential Statistics AO1 AO2 >
      • Chi-Squared Test AO1 AO2
      • Mann-Whitney U Test AO1 AO2
      • Spearman's Rho AO1 AO2
      • Wilcoxon Test AO1 AO2
    • Longitudinal Design AO1 AO2 AO3
    • Quantitative Data & Analysis AO1 AO2 AO3
    • Research Design AO1 AO2 AO3
    • Sampling AO1 AO2 AO3
    • Self Report Method AO1 AO2 AO3 >
      • Brown et al. AO1 AO3
  • Blog
  • Contact
  • Resources