PSYCHOLOGY WIZARD
  • Home
  • Unit 1 FOUNDATIONS
    • Biological >
      • Adoption & Twin Studies AO1 AO2 AO3 >
        • Gottesman & Shields AO1 AO3
        • Kety AO1 AO3
      • Aggression AO1 AO2 AO3 >
        • Evolutionary Psychology AO1 AO2 AO3
      • The Brain AO1 AO2 >
        • Drugs & the Brain AO1 AO2 AO3
      • Brendgen AO1 AO3
      • Development (Maturation) AO1 AO2 AO3
      • Freud's Psychodynamic Theory AO1 AO3 >
        • Aggression & Freud AO1 AO2 AO3
        • Development & Freud AO1 AO2 AO3
        • Individual Differences & Freud AO1 AO2 AO3
      • Raine AO1 AO3
      • Biological Key Question AO1 AO2
    • Cognitive >
      • Baddeley AO1 AO3
      • Multi Store Model AO1 AO2 AO3
      • Reconstructive Memory AO1 AO2 AO3
      • Schmolck AO1 AO3
      • Tulving's Long Term Memory AO1 AO2 AO3
      • Working Memory AO1 AO2 AO3
      • Cognitive Key Question AO1 AO2
    • Learning >
      • Bandura AO1 >
        • Bandura AO3
      • Becker AO1 AO3
      • Classical Conditioning AO1 AO2 AO3
      • Operant Conditioning AO1 AO2 AO3
      • Pavlov AO1 AO3
      • Social Learning AO1 AO2 AO3
      • Therapies for Phobias >
        • Flooding
        • Systematic Desensitisation
      • Watson & Rayner AO1 AO3
      • Learning Key Question AO1 AO2
    • Social >
      • Agency Theory AO1 AO2 AO3
      • Burger AO1 AO3
      • Situational Factors AO1 AO2 AO3
      • Milgram AO1 >
        • Milgram AO3
      • Realistic Conflict Theory AO1 AO2 AO3
      • Sherif AO1 >
        • Sherif AO3
      • Social Impact Theory AO1 AO2 AO3
      • Social Identity Theory AO1 AO2 AO3
      • Social Key Question AO1 AO2
  • Unit 2 APPLICATIONS
    • Clinical >
      • Depression AO1 AO2 >
        • Biological Explanation AO1 AO2
        • Non-Biological Explanation AO1 AO2
        • Biological Treatment AO1 AO2
        • Psychological Treatment AO1 AO2
      • Diagnosing Abnormality AO1 AO2 AO3
      • Diagnostic Manuals AO1 AO2 AO3
      • Carlsson AO1 AO3
      • Kroenke AO1 AO3
      • HCPC Guidelines AO1 AO2 AO3
      • Rosenhan AO1 AO3
      • Schizophrenia AO1 AO2 >
        • Biological Explanation AO1 AO2
        • Non-biological Explanation AO1 AO2
        • Biological Treatments AO1 AO2
        • Psychological Treatment AO1 AO2
      • Clinical Key Question AO1 AO2
      • Issues & Debates >
        • Social Control AO2 AO3
  • Evaluation
    • Ethics AO1 AO2 AO3
    • Individual Differences AO1 AO2 AO3 >
      • Brain Differences AO1 AO2 AO3 >
        • Personality AO1 AO2 AO3
      • Mental Health Differences AO1 AO2 AO3
      • Differences in Obedience & Prejudice AO1 AO2 AO3
      • Memory Differences AO1 AO2 AO3 >
        • Loftus study AO1 AO2 AO3
    • Nature vs Nurture AO1 AO2 AO3
    • Scientific Status AO1 AO2
  • Methods
    • Animal Studies AO1 AO2 AO3
    • Case Studies AO1 AO2 AO3 >
      • Bradshaw AO1 AO3
      • Scoville & Milner AO1 AO3
    • Content Analyses AO1 AO2 AO3
    • Experimental Method AO1 AO2 AO3
    • Experimental Variables AO1 AO2
    • Hypotheses AO1 AO2
    • Inferential Statistics AO1 AO2 >
      • Chi-Squared Test AO1 AO2
      • Mann-Whitney U Test AO1 AO2
      • Spearman's Rho AO1 AO2
      • Wilcoxon Test AO1 AO2
    • Longitudinal Design AO1 AO2 AO3
    • Quantitative Data & Analysis AO1 AO2 AO3
    • Research Design AO1 AO2 AO3
    • Sampling AO1 AO2 AO3
    • Self Report Method AO1 AO2 AO3 >
      • Brown et al. AO1 AO3
  • Blog
  • Contact
  • Resources
Picture

WHAT IS THE WILCOXON TEST?

This is an inferential test created by Frank Wilcoxon (left). It is used when:

  • You have a test of difference (experiment) with repeated measures design or matched pairs design
  • The data is at least ordinal level*
 
(* it’s easy to turn interval/ratio level data into ordinal data: you just put the scores into rank order)
 
The Edexcel exam might ask you about the appropriateness of the Wilcoxon test – when you would use it. But you could be asked to calculate the test. The process and tables are provided at the front of the exam booklet.

If you are using an independent groups design, use the Mann-Whitney U test instead.
Picture
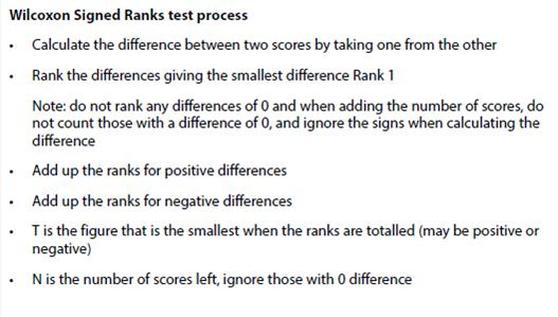
Yes, Wilcoxon is so straightforward you don’t get a mathematical formula: just the instructions on how to do it

MAKING THE CALCULATIONS

Of course, most researchers use computers to do their statistical tests. There are lots of websites that will let you input your data from an experiment and carry out the Wilcoxon test for you.
Calculate Wilcoxon test here
The Exam expects you to be able to work out the Wilcoxon test "by hand" and, actually, it's not that difficult.

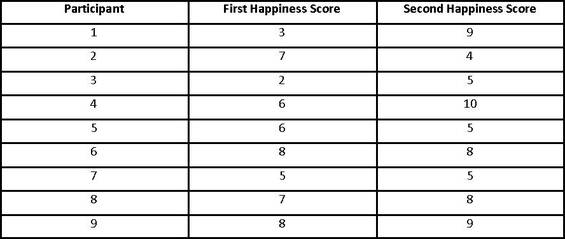
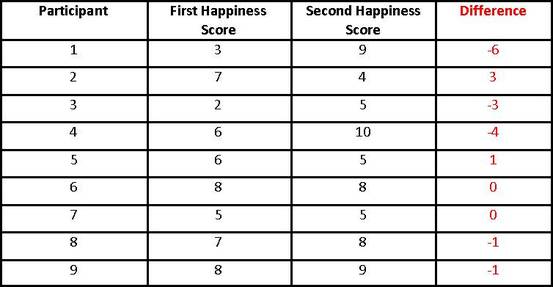
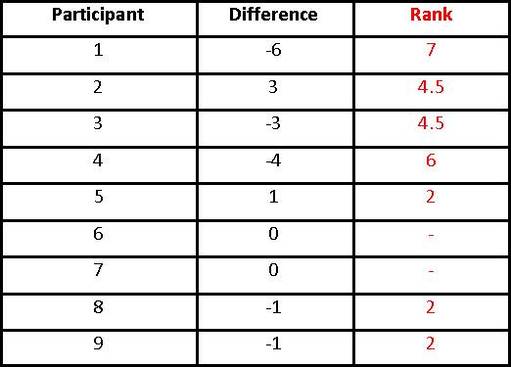
You are trying to work out the value of T and to do this you need to take the score in one condition away from its matched score in the other condition. This leaves you with a "difference" that may be positive, negative or zero.

You next rank all the differences, leaving out the 0s. The smallest difference gets ranks 1, the next smallest rank 2, and so on. Treat positive and negative differences as being the same for purposes of ranking.

Once this is done, work out the sum of the ranks that are positive and then the sum of the ranks that are negative (ignoring the 0s). Choose the lowest total to be T.
 
You also need a value of N, which is the number of non-zero differences.
 
Before you can look up the critical value, you need to know two things:
 
Is your experimental hypothesis 1-tailed (directional) or 2-tailed (non-directional)? You look on a different table for each.
 
What value of probability (p) are you considering? Normally, a classroom experiment would be considered at a value of p≤0.05
 
  1. Choose the table for your type of hypothesis and value of p
  2. Read down until you get to the row matching your score for N
  3. This is your critical value
Picture
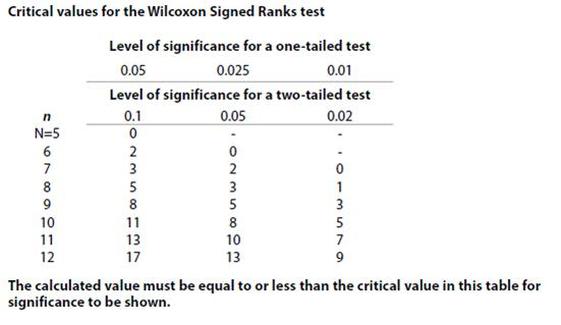
If you look closely at these tables, you'll notice that the critical values for 2-tailed tests are a bit lower than the values for 1-tailed tests. This reflects the fact that, being a bit more vague, 2-tailed tests require stronger evidence of difference.
If your value of T is equal to or less than the critical value, you can refute your null hypothesis (and cautiously accept your hypothesis).
 
If T is greater than the critical value, you must accept your null hypothesis and reject your experimental hypothesis.
If your value of U is equal to or less than the critical value, you can refute your null hypothesis (and cautiously accept your hypothesis).
 
If the value of U is greater than the critical value, you must accept your null hypothesis and refute your experimental hypothesis.

A STATEMENT OF STATISTICAL SIGNIFICANCE

You can sum up your statistical test with a statement of statistical significance. This will include:
  1. The test used
  2. The observed (T) and critical values
  3. The direction of the hypothesis
  4. The chosen value of p
  5. The conclusion, in terms of the null hypothesis

For example:

The results were subjected to a Wilcoxon test
The observed value (T) was 9, which is lower than the critical value of 11 for a 1-tailed test where p≤0.05
Therefore, the null hypothesis can be refuted
Picture
Picture

APPLYING WILCOXON'S TEST IN PSYCHOLOGY
AO2

One of the studies in Unit 1 that uses Wilcoxon’s test is Baddeley (1966b).

Baddeley used this test because he had carried out a test of difference (an experiment) with repeated measures design - he was comparing the scores of participants in their 4th recall trial with their scores 15 minutes later in the “forgetting” test.

Baddeley had collected interval/ratio level data - each of his participants had a score out of 10 on their test. However, it is very easy to turn this into the ordinal level data needed for the Wilcoxon test. Baddeley just ranked the scores in order from highest to lowest and gave each participant a rank (1, 2, 3, etc) based on where their score appeared.

Baddeley also used an independent groups design, because he also compared the participants who learned similar words with ones who learned dissimilar words. For this, he used the Mann-Whitney U test.
 
Another study that used the Wilcoxon test was Bandura, Ross & Ross (1963). This study was not a repeated measures design. However, the children were matched on aggression across all the groups so it was a matched pairs design, which also uses this test.
Picture

EXEMPLAR CALCULATION
How to DO IT IN THE EXAM

Brandon wants to see if people are made happier by watching videos of cats falling off shelves. He asks 9 classmates to rate their happiness on a 1-10 scale, then he shows them a 3 minute clip of “EPIC CAT FAILS”.
After the clip, he gets them to rate their happiness again.

  • You need to look for information to work out what's going on. This is definitely an experiment because two different sets of scores are being compared. It's a repeated measures design because "[a]fter the clip, he gets them to rate their happiness again" – so the same participants are in each condition.

The results are shown below:
Picture
Calculate whether people give significantly higher Happiness scores after watching “EPIC CAT FAILS” by using the Wilcoxon test. [4 marks]
The first thing to do is work out the differences between the scores in the two conditions:
Picture
Now you rank the differences, giving the smallest difference a rank of 1:
Picture
Notice how participants 6 and 7 have a difference of 0, so they don’t get a rank. Participants 2 and 3 both have a difference of 3 (one positive, one negative) so they share the same rank of 4.5 (the mean average of rank 4 and rank 4); participants 5, 8 and 9 all have a difference of 1 and share rank 2 (mean of ranks 1, 2 and 3).
Finally we add up all the ranks for positive differences (4.5 + 2 = 6.5) and negative differences (7 + 4.5 + 6 + 2 + 2). The lowest number is T, so T = 6.5

All we have to do now is compare our observed value to the critical value. With a 1-tailed hypothesis at the p≤0.05 level of probability, we can easily find the critical value where N= 7 (because there are 7 non-zero differences):
Picture
The critical value is 3 and our observed value is larger than that, so the results are not statistically significant.

If you look back at the raw data you can see that the video made 5 people cheer up, but two actually got grumpier and one stayed the same. The statistics confirm that that participant 4 (who cheered up massively) wasn’t enough to cancel out the others who only got slightly happier or didn’t get happier at all. Epic Fail!.

Here's the statement of significance:

The results were subjected to a Wilcoxon test. The observed value of T was 6.5. This was higher than the critical value of 3, for a 1-tailed test at the p≤0.05 level of probability. Therefore the null hypothesis can be accepted and the experimental hypothesis is refuted.
Home
Blog
Contact

PSYCHOLOGYWIZARD.NET
  • Home
  • Unit 1 FOUNDATIONS
    • Biological >
      • Adoption & Twin Studies AO1 AO2 AO3 >
        • Gottesman & Shields AO1 AO3
        • Kety AO1 AO3
      • Aggression AO1 AO2 AO3 >
        • Evolutionary Psychology AO1 AO2 AO3
      • The Brain AO1 AO2 >
        • Drugs & the Brain AO1 AO2 AO3
      • Brendgen AO1 AO3
      • Development (Maturation) AO1 AO2 AO3
      • Freud's Psychodynamic Theory AO1 AO3 >
        • Aggression & Freud AO1 AO2 AO3
        • Development & Freud AO1 AO2 AO3
        • Individual Differences & Freud AO1 AO2 AO3
      • Raine AO1 AO3
      • Biological Key Question AO1 AO2
    • Cognitive >
      • Baddeley AO1 AO3
      • Multi Store Model AO1 AO2 AO3
      • Reconstructive Memory AO1 AO2 AO3
      • Schmolck AO1 AO3
      • Tulving's Long Term Memory AO1 AO2 AO3
      • Working Memory AO1 AO2 AO3
      • Cognitive Key Question AO1 AO2
    • Learning >
      • Bandura AO1 >
        • Bandura AO3
      • Becker AO1 AO3
      • Classical Conditioning AO1 AO2 AO3
      • Operant Conditioning AO1 AO2 AO3
      • Pavlov AO1 AO3
      • Social Learning AO1 AO2 AO3
      • Therapies for Phobias >
        • Flooding
        • Systematic Desensitisation
      • Watson & Rayner AO1 AO3
      • Learning Key Question AO1 AO2
    • Social >
      • Agency Theory AO1 AO2 AO3
      • Burger AO1 AO3
      • Situational Factors AO1 AO2 AO3
      • Milgram AO1 >
        • Milgram AO3
      • Realistic Conflict Theory AO1 AO2 AO3
      • Sherif AO1 >
        • Sherif AO3
      • Social Impact Theory AO1 AO2 AO3
      • Social Identity Theory AO1 AO2 AO3
      • Social Key Question AO1 AO2
  • Unit 2 APPLICATIONS
    • Clinical >
      • Depression AO1 AO2 >
        • Biological Explanation AO1 AO2
        • Non-Biological Explanation AO1 AO2
        • Biological Treatment AO1 AO2
        • Psychological Treatment AO1 AO2
      • Diagnosing Abnormality AO1 AO2 AO3
      • Diagnostic Manuals AO1 AO2 AO3
      • Carlsson AO1 AO3
      • Kroenke AO1 AO3
      • HCPC Guidelines AO1 AO2 AO3
      • Rosenhan AO1 AO3
      • Schizophrenia AO1 AO2 >
        • Biological Explanation AO1 AO2
        • Non-biological Explanation AO1 AO2
        • Biological Treatments AO1 AO2
        • Psychological Treatment AO1 AO2
      • Clinical Key Question AO1 AO2
      • Issues & Debates >
        • Social Control AO2 AO3
  • Evaluation
    • Ethics AO1 AO2 AO3
    • Individual Differences AO1 AO2 AO3 >
      • Brain Differences AO1 AO2 AO3 >
        • Personality AO1 AO2 AO3
      • Mental Health Differences AO1 AO2 AO3
      • Differences in Obedience & Prejudice AO1 AO2 AO3
      • Memory Differences AO1 AO2 AO3 >
        • Loftus study AO1 AO2 AO3
    • Nature vs Nurture AO1 AO2 AO3
    • Scientific Status AO1 AO2
  • Methods
    • Animal Studies AO1 AO2 AO3
    • Case Studies AO1 AO2 AO3 >
      • Bradshaw AO1 AO3
      • Scoville & Milner AO1 AO3
    • Content Analyses AO1 AO2 AO3
    • Experimental Method AO1 AO2 AO3
    • Experimental Variables AO1 AO2
    • Hypotheses AO1 AO2
    • Inferential Statistics AO1 AO2 >
      • Chi-Squared Test AO1 AO2
      • Mann-Whitney U Test AO1 AO2
      • Spearman's Rho AO1 AO2
      • Wilcoxon Test AO1 AO2
    • Longitudinal Design AO1 AO2 AO3
    • Quantitative Data & Analysis AO1 AO2 AO3
    • Research Design AO1 AO2 AO3
    • Sampling AO1 AO2 AO3
    • Self Report Method AO1 AO2 AO3 >
      • Brown et al. AO1 AO3
  • Blog
  • Contact
  • Resources