PSYCHOLOGY WIZARD
  • Home
  • Unit 1 FOUNDATIONS
    • Biological >
      • Adoption & Twin Studies AO1 AO2 AO3 >
        • Gottesman & Shields AO1 AO3
        • Kety AO1 AO3
      • Aggression AO1 AO2 AO3 >
        • Evolutionary Psychology AO1 AO2 AO3
      • The Brain AO1 AO2 >
        • Drugs & the Brain AO1 AO2 AO3
      • Brendgen AO1 AO3
      • Development (Maturation) AO1 AO2 AO3
      • Freud's Psychodynamic Theory AO1 AO3 >
        • Aggression & Freud AO1 AO2 AO3
        • Development & Freud AO1 AO2 AO3
        • Individual Differences & Freud AO1 AO2 AO3
      • Raine AO1 AO3
      • Biological Key Question AO1 AO2
    • Cognitive >
      • Baddeley AO1 AO3
      • Multi Store Model AO1 AO2 AO3
      • Reconstructive Memory AO1 AO2 AO3
      • Schmolck AO1 AO3
      • Tulving's Long Term Memory AO1 AO2 AO3
      • Working Memory AO1 AO2 AO3
      • Cognitive Key Question AO1 AO2
    • Learning >
      • Bandura AO1 >
        • Bandura AO3
      • Becker AO1 AO3
      • Classical Conditioning AO1 AO2 AO3
      • Operant Conditioning AO1 AO2 AO3
      • Pavlov AO1 AO3
      • Social Learning AO1 AO2 AO3
      • Therapies for Phobias >
        • Flooding
        • Systematic Desensitisation
      • Watson & Rayner AO1 AO3
      • Learning Key Question AO1 AO2
    • Social >
      • Agency Theory AO1 AO2 AO3
      • Burger AO1 AO3
      • Situational Factors AO1 AO2 AO3
      • Milgram AO1 >
        • Milgram AO3
      • Realistic Conflict Theory AO1 AO2 AO3
      • Sherif AO1 >
        • Sherif AO3
      • Social Impact Theory AO1 AO2 AO3
      • Social Identity Theory AO1 AO2 AO3
      • Social Key Question AO1 AO2
  • Unit 2 APPLICATIONS
    • Clinical >
      • Depression AO1 AO2 >
        • Biological Explanation AO1 AO2
        • Non-Biological Explanation AO1 AO2
        • Biological Treatment AO1 AO2
        • Psychological Treatment AO1 AO2
      • Diagnosing Abnormality AO1 AO2 AO3
      • Diagnostic Manuals AO1 AO2 AO3
      • Carlsson AO1 AO3
      • Kroenke AO1 AO3
      • HCPC Guidelines AO1 AO2 AO3
      • Rosenhan AO1 AO3
      • Schizophrenia AO1 AO2 >
        • Biological Explanation AO1 AO2
        • Non-biological Explanation AO1 AO2
        • Biological Treatments AO1 AO2
        • Psychological Treatment AO1 AO2
      • Clinical Key Question AO1 AO2
      • Issues & Debates >
        • Social Control AO2 AO3
  • Evaluation
    • Ethics AO1 AO2 AO3
    • Individual Differences AO1 AO2 AO3 >
      • Brain Differences AO1 AO2 AO3 >
        • Personality AO1 AO2 AO3
      • Mental Health Differences AO1 AO2 AO3
      • Differences in Obedience & Prejudice AO1 AO2 AO3
      • Memory Differences AO1 AO2 AO3 >
        • Loftus study AO1 AO2 AO3
    • Nature vs Nurture AO1 AO2 AO3
    • Scientific Status AO1 AO2
  • Methods
    • Animal Studies AO1 AO2 AO3
    • Case Studies AO1 AO2 AO3 >
      • Bradshaw AO1 AO3
      • Scoville & Milner AO1 AO3
    • Content Analyses AO1 AO2 AO3
    • Experimental Method AO1 AO2 AO3
    • Experimental Variables AO1 AO2
    • Hypotheses AO1 AO2
    • Inferential Statistics AO1 AO2 >
      • Chi-Squared Test AO1 AO2
      • Mann-Whitney U Test AO1 AO2
      • Spearman's Rho AO1 AO2
      • Wilcoxon Test AO1 AO2
    • Longitudinal Design AO1 AO2 AO3
    • Quantitative Data & Analysis AO1 AO2 AO3
    • Research Design AO1 AO2 AO3
    • Sampling AO1 AO2 AO3
    • Self Report Method AO1 AO2 AO3 >
      • Brown et al. AO1 AO3
  • Blog
  • Contact
  • Resources
Picture
Picture

WHAT IS THE MANN-WHITNEY U TEST?

This is an inferential test created by Henry Mann (left) and Donald Whitney (below, left). It is used when:

  • You have a test of difference (experiment) with independent groups design
  • The data is at least ordinal level*
 
(* it’s easy to turn interval/ratio level data into ordinal data: you just put the scores into rank order)
 
The Edexcel exam might ask you about the appropriateness of the Mann-Whitney U test – when you would use it. But you could be asked to calculate the test. The equation and tables are provided at the front of the exam booklet.

If you are using a Matched Pairs or Repeated Measures design, use the Wilcoxon test instead.
Picture

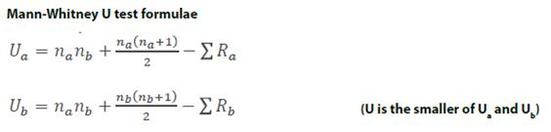
MAKING THE CALCULATIONS

Of course, most researchers use computers to do their statistical tests. There are lots of websites that will let you input your data from an experiment and carry out the Mann-Whitney U test for you.
Calculate Mann-Whitney U test here
The Exam expects you to be able to work out the Mann-Whitney U test "by hand" and, although it's fiddly, it's not that difficult.

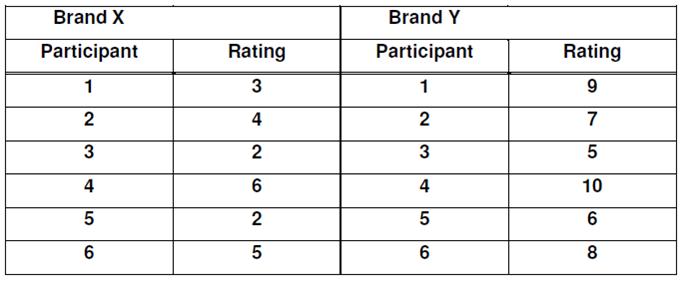
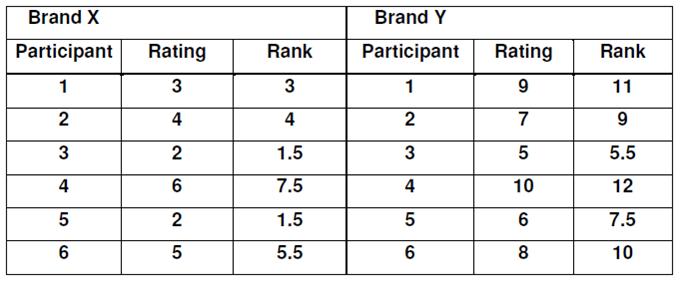
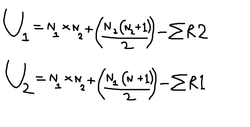
You are trying to work out the value of U and to do this you need to calculate two scores called Ua and Ub and choose the lowest of the two.
 
The test uses ordinal level data, so you will probably need to turn your interval/ratio data into ordinal data. You do this by “ranking” the scores in each condition; the top scores gets rank 1, the next score gets rank 2 and so on; identical scores get the mean rank they share (so if there are 3 scores sharing 1st place, instead of getting ranks 1, 2 and 3, they all get rank 2).

  • You work out the ranks for all the scores together, taking the numbers from both conditions

You will need to know na and nb; na is the total number of scores you have in Condition A and nb is the number of scores in Condition B.

The first step is to calculate Ua:
Picture
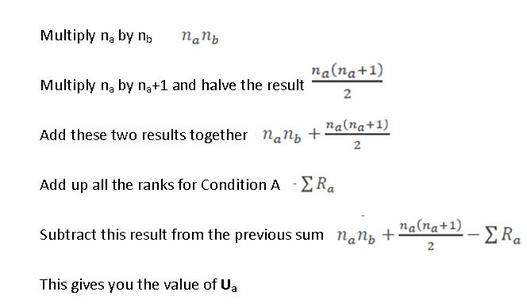
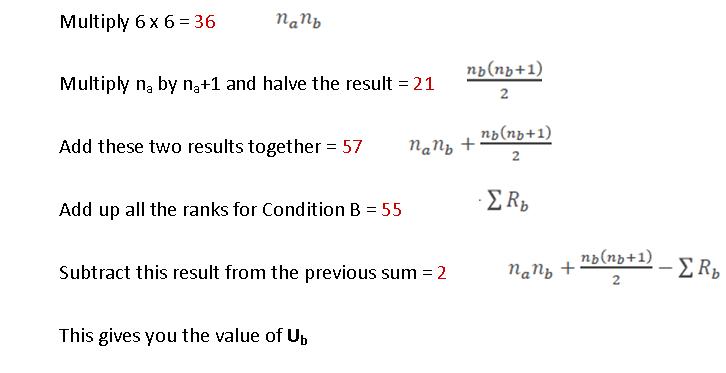
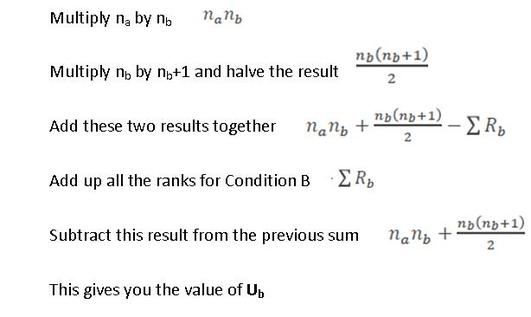
The next step is to calculate Ub:
Picture
Your observed value (U) will be the lower of Ua and Ub. You will compare U to the critical value and you are looking for U to be lower than the critical value.
 
Before you can look up the critical value, you need to know two things:
  •  Is your experimental hypothesis 1-tailed (directional) or 2-tailed (non-directional)? You will; use a different table depending on the type of hypothesis.
  • What value of probability (p) are you considering? Normally, a classroom experiment would be considered at a value of p≤0.05

Once you know these two things, you can finish the calculation:

  1. Choose the table for your type of hypothesis and value of p
  2. Read along the top until you get to the column matching your score for nb
  3. Read down until you get to the row matching your score for na
  4. This is your critical value
Picture
Picture
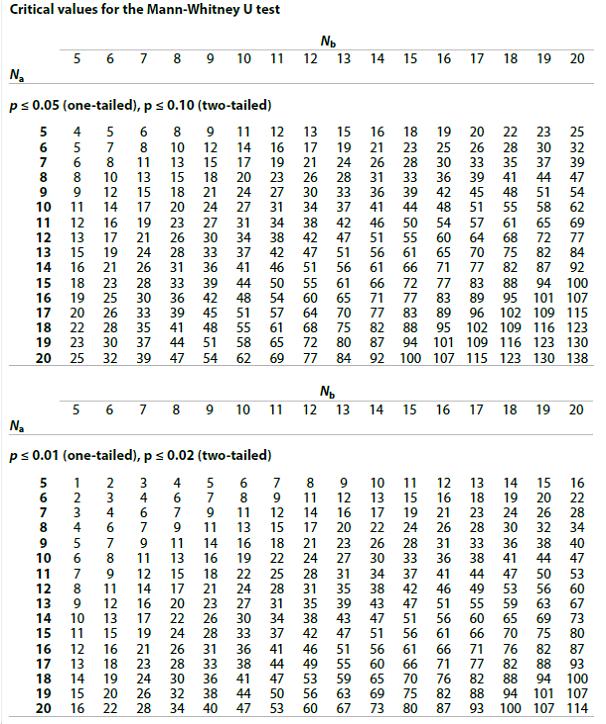
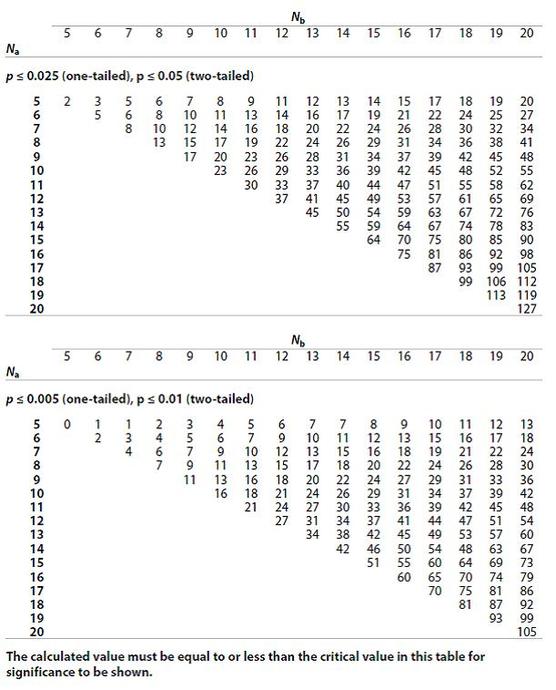
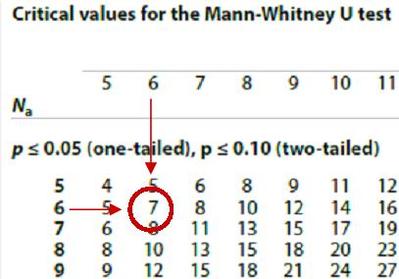
If you look closely at these tables, you'll notice that the critical values for 2-tailed tests are a bit lower than the values for 1-tailed tests. This reflects the fact that, being a bit more vague, 2-tailed tests require stronger evidence of difference.
If your value of U is equal to or less than the critical value, you can refute your null hypothesis (and cautiously accept your hypothesis).
 
If the value of U is greater than the critical value, you must accept your null hypothesis and refute your experimental hypothesis.

A STATEMENT OF STATISTICAL SIGNIFICANCE

You can sum up your statistical test with a statement of statistical significance. This will include:
  1. The test used
  2. The observed (U) and critical values
  3. The direction of the hypothesis
  4. The chosen value of p
  5. The conclusion, in terms of the null hypothesis

For example:

The results were subjected to a Mann-Whitney U test
The observed value (U) was 17, which is lower than the critical value of 20 for a 1-tailed test where p≤0.05
Therefore, the null hypothesis can be refuted

Picture

APPLYING MANN-WHITNEY U TEST IN PSYCHOLOGY
AO2

One of the studies in Unit 1 that uses the Mann-Whitney U test is Baddeley (1966b).

Baddeley used this test because he had carried out a test of difference (an experiment) with independent groups design - he was comparing the scores of participants in one condition (acoustically-similar or semantically-similar words) with the scores of participants in another condition (acoustically or semantically dissimilar words).

Baddeley had collected interval/ratio level data - each of his participants had a score out of 10 on their recall test. However, it is very easy to turn this into the ordinal level data needed for the Mann-Whitney U test. Baddeley just ranked the scores in order from highest to lowest and gave each participant a rank (1, 2, 3, etc) based on where their score appeared.

Baddeley was testing a 1-tailed hypothesis at the p≤0.05 level of probability. In fact, p≤0.05 is not a very strict level of probability. Most researchers would aim for a stricter value of p, such as p≤0.01 instead. This tells us that, while Baddeley's results were statistically significant, there's a 5% chance that the differences between the groups could have been down to random variations.

Because we know that Baddeley had 15 participants in the acoustically-similar condition and 20 in the acoustically-dissimilar, you can look up his critical value on the tables above.


Baddeley also used a repeated measures design, because he also compared participants' scores on the 5th "forgetting" test with their own earlier scores on the 4th recall trial. For this, he used the Wilcoxon inferential test.
Picture

EXEMPLAR CALCULATION
How to DO IT IN THE EXAM

A company wants to compare the effectiveness of advertising for two rival products (Brand X and Brand Y). They carry out market research at a local shopping centre. 12 participants are shown adverts for two rival brands of coffee, which they then rate on the overall likelihood of them buying the product (out of 10, with 10 being "definitely going to buy the product"). Half of the participants give ratings for one product; the other half give ratings for the other product.

  • You need to look for information to work out what's going on. This is definitely an experiment because two different sets of scores are being compared. It's an independent groups design because "half of the participants give ratings for one product; the other half give ratings for the other product".

The results are shown below:

Picture
Calculate whether Brand Y gets statistically higher scores than Brand X using the Mann Whitney U test [4 marks]
The first thing to do is put the two sets of scores into rank order; this is turning interval/ratio level data into the ordinal level data you need for the test.

Then you add up the sum of the ranks for each condition.
Picture
Notice how participants 3 and 4 in the Brand X condition tie for lowest place, so they get rank 1.5 (the mean average of ranks 1 and 2). Participant 4 in the Brand Y condition gave the highest score so he gets the highest rank of 12.

It doesn't make any difference to the maths if you rank the other way round, giving the highest score rank 1 and the two lowest scores sharing rank 11.5.
Now you can carry out the test. The values for na and nb are both 6, because there are 6 scores in each Condition. Condition B (Brand Y) has the largest sum of ranks (55) so we'll work out Ub.
Picture
In this case we don't have to work out Ua because Ub is clearly the lower score. However, if there was a different number of scores in each condition (if na and nb weren't the same) then we would have to work out the other value of Ua as well.
All we have to do now is compare our observed value to the critical value. With a 1-tailed hypothesis at the p≤0.05 level of probability, we can easily find the critical value where na and nb are both 6:
Picture
The critical value is 7 and our observed value is much lower than that, so the results are statistically significant.

If you look back at the raw data you can see that Brand X's adverts are rubbish: the highest score anyone gave it was 6 and the lowest score anyone gave Brand Y was 5, so it's not a surprise that there's a statistical difference. Nevertheless, statistics back up our impressions.

Here's the statement of significance:

The results were subjected to a Mann-Whitney U test. The observed value of U was 2. This was lower than the critical value of 7, for a 1-tailed test at the p≤0.05 level of probability. Therefore the null hypothesis can be refuted and the experimental hypothesis is accepted.
Home
Blog
Contact

PSYCHOLOGYWIZARD.NET
  • Home
  • Unit 1 FOUNDATIONS
    • Biological >
      • Adoption & Twin Studies AO1 AO2 AO3 >
        • Gottesman & Shields AO1 AO3
        • Kety AO1 AO3
      • Aggression AO1 AO2 AO3 >
        • Evolutionary Psychology AO1 AO2 AO3
      • The Brain AO1 AO2 >
        • Drugs & the Brain AO1 AO2 AO3
      • Brendgen AO1 AO3
      • Development (Maturation) AO1 AO2 AO3
      • Freud's Psychodynamic Theory AO1 AO3 >
        • Aggression & Freud AO1 AO2 AO3
        • Development & Freud AO1 AO2 AO3
        • Individual Differences & Freud AO1 AO2 AO3
      • Raine AO1 AO3
      • Biological Key Question AO1 AO2
    • Cognitive >
      • Baddeley AO1 AO3
      • Multi Store Model AO1 AO2 AO3
      • Reconstructive Memory AO1 AO2 AO3
      • Schmolck AO1 AO3
      • Tulving's Long Term Memory AO1 AO2 AO3
      • Working Memory AO1 AO2 AO3
      • Cognitive Key Question AO1 AO2
    • Learning >
      • Bandura AO1 >
        • Bandura AO3
      • Becker AO1 AO3
      • Classical Conditioning AO1 AO2 AO3
      • Operant Conditioning AO1 AO2 AO3
      • Pavlov AO1 AO3
      • Social Learning AO1 AO2 AO3
      • Therapies for Phobias >
        • Flooding
        • Systematic Desensitisation
      • Watson & Rayner AO1 AO3
      • Learning Key Question AO1 AO2
    • Social >
      • Agency Theory AO1 AO2 AO3
      • Burger AO1 AO3
      • Situational Factors AO1 AO2 AO3
      • Milgram AO1 >
        • Milgram AO3
      • Realistic Conflict Theory AO1 AO2 AO3
      • Sherif AO1 >
        • Sherif AO3
      • Social Impact Theory AO1 AO2 AO3
      • Social Identity Theory AO1 AO2 AO3
      • Social Key Question AO1 AO2
  • Unit 2 APPLICATIONS
    • Clinical >
      • Depression AO1 AO2 >
        • Biological Explanation AO1 AO2
        • Non-Biological Explanation AO1 AO2
        • Biological Treatment AO1 AO2
        • Psychological Treatment AO1 AO2
      • Diagnosing Abnormality AO1 AO2 AO3
      • Diagnostic Manuals AO1 AO2 AO3
      • Carlsson AO1 AO3
      • Kroenke AO1 AO3
      • HCPC Guidelines AO1 AO2 AO3
      • Rosenhan AO1 AO3
      • Schizophrenia AO1 AO2 >
        • Biological Explanation AO1 AO2
        • Non-biological Explanation AO1 AO2
        • Biological Treatments AO1 AO2
        • Psychological Treatment AO1 AO2
      • Clinical Key Question AO1 AO2
      • Issues & Debates >
        • Social Control AO2 AO3
  • Evaluation
    • Ethics AO1 AO2 AO3
    • Individual Differences AO1 AO2 AO3 >
      • Brain Differences AO1 AO2 AO3 >
        • Personality AO1 AO2 AO3
      • Mental Health Differences AO1 AO2 AO3
      • Differences in Obedience & Prejudice AO1 AO2 AO3
      • Memory Differences AO1 AO2 AO3 >
        • Loftus study AO1 AO2 AO3
    • Nature vs Nurture AO1 AO2 AO3
    • Scientific Status AO1 AO2
  • Methods
    • Animal Studies AO1 AO2 AO3
    • Case Studies AO1 AO2 AO3 >
      • Bradshaw AO1 AO3
      • Scoville & Milner AO1 AO3
    • Content Analyses AO1 AO2 AO3
    • Experimental Method AO1 AO2 AO3
    • Experimental Variables AO1 AO2
    • Hypotheses AO1 AO2
    • Inferential Statistics AO1 AO2 >
      • Chi-Squared Test AO1 AO2
      • Mann-Whitney U Test AO1 AO2
      • Spearman's Rho AO1 AO2
      • Wilcoxon Test AO1 AO2
    • Longitudinal Design AO1 AO2 AO3
    • Quantitative Data & Analysis AO1 AO2 AO3
    • Research Design AO1 AO2 AO3
    • Sampling AO1 AO2 AO3
    • Self Report Method AO1 AO2 AO3 >
      • Brown et al. AO1 AO3
  • Blog
  • Contact
  • Resources