PSYCHOLOGY WIZARD
  • Home
  • Unit 1 FOUNDATIONS
    • Biological >
      • Adoption & Twin Studies AO1 AO2 AO3 >
        • Gottesman & Shields AO1 AO3
        • Kety AO1 AO3
      • Aggression AO1 AO2 AO3 >
        • Evolutionary Psychology AO1 AO2 AO3
      • The Brain AO1 AO2 >
        • Drugs & the Brain AO1 AO2 AO3
      • Brendgen AO1 AO3
      • Development (Maturation) AO1 AO2 AO3
      • Freud's Psychodynamic Theory AO1 AO3 >
        • Aggression & Freud AO1 AO2 AO3
        • Development & Freud AO1 AO2 AO3
        • Individual Differences & Freud AO1 AO2 AO3
      • Raine AO1 AO3
      • Biological Key Question AO1 AO2
    • Cognitive >
      • Baddeley AO1 AO3
      • Multi Store Model AO1 AO2 AO3
      • Reconstructive Memory AO1 AO2 AO3
      • Schmolck AO1 AO3
      • Tulving's Long Term Memory AO1 AO2 AO3
      • Working Memory AO1 AO2 AO3
      • Cognitive Key Question AO1 AO2
    • Learning >
      • Bandura AO1 >
        • Bandura AO3
      • Becker AO1 AO3
      • Classical Conditioning AO1 AO2 AO3
      • Operant Conditioning AO1 AO2 AO3
      • Pavlov AO1 AO3
      • Social Learning AO1 AO2 AO3
      • Therapies for Phobias >
        • Flooding
        • Systematic Desensitisation
      • Watson & Rayner AO1 AO3
      • Learning Key Question AO1 AO2
    • Social >
      • Agency Theory AO1 AO2 AO3
      • Burger AO1 AO3
      • Situational Factors AO1 AO2 AO3
      • Milgram AO1 >
        • Milgram AO3
      • Realistic Conflict Theory AO1 AO2 AO3
      • Sherif AO1 >
        • Sherif AO3
      • Social Impact Theory AO1 AO2 AO3
      • Social Identity Theory AO1 AO2 AO3
      • Social Key Question AO1 AO2
  • Unit 2 APPLICATIONS
    • Clinical >
      • Depression AO1 AO2 >
        • Biological Explanation AO1 AO2
        • Non-Biological Explanation AO1 AO2
        • Biological Treatment AO1 AO2
        • Psychological Treatment AO1 AO2
      • Diagnosing Abnormality AO1 AO2 AO3
      • Diagnostic Manuals AO1 AO2 AO3
      • Carlsson AO1 AO3
      • Kroenke AO1 AO3
      • HCPC Guidelines AO1 AO2 AO3
      • Rosenhan AO1 AO3
      • Schizophrenia AO1 AO2 >
        • Biological Explanation AO1 AO2
        • Non-biological Explanation AO1 AO2
        • Biological Treatments AO1 AO2
        • Psychological Treatment AO1 AO2
      • Clinical Key Question AO1 AO2
      • Issues & Debates >
        • Social Control AO2 AO3
  • Evaluation
    • Ethics AO1 AO2 AO3
    • Individual Differences AO1 AO2 AO3 >
      • Brain Differences AO1 AO2 AO3 >
        • Personality AO1 AO2 AO3
      • Mental Health Differences AO1 AO2 AO3
      • Differences in Obedience & Prejudice AO1 AO2 AO3
      • Memory Differences AO1 AO2 AO3 >
        • Loftus study AO1 AO2 AO3
    • Nature vs Nurture AO1 AO2 AO3
    • Scientific Status AO1 AO2
  • Methods
    • Animal Studies AO1 AO2 AO3
    • Case Studies AO1 AO2 AO3 >
      • Bradshaw AO1 AO3
      • Scoville & Milner AO1 AO3
    • Content Analyses AO1 AO2 AO3
    • Experimental Method AO1 AO2 AO3
    • Experimental Variables AO1 AO2
    • Hypotheses AO1 AO2
    • Inferential Statistics AO1 AO2 >
      • Chi-Squared Test AO1 AO2
      • Mann-Whitney U Test AO1 AO2
      • Spearman's Rho AO1 AO2
      • Wilcoxon Test AO1 AO2
    • Longitudinal Design AO1 AO2 AO3
    • Quantitative Data & Analysis AO1 AO2 AO3
    • Research Design AO1 AO2 AO3
    • Sampling AO1 AO2 AO3
    • Self Report Method AO1 AO2 AO3 >
      • Brown et al. AO1 AO3
  • Blog
  • Contact
  • Resources
Picture

WHY INFERENTIAL STATISTICS?

Inferential statistical tests are more powerful than the descriptive statistical tests like measures of central tendency (mean, mode, median) or measures of dispersion (range, standard deviation).
 
Descriptive statistics analyse the findings from a sample, but inferential statistics tell you how the sample’s results relate back to the target population from which the sample was drawn. This is vital for working out whether the results support the null hypothesis or force you to reject it in favour of the alternative hypothesis.
 
  • Mann-Whitney U-test is for experiments with independent groups design
  • Wilcoxon test is for experiments with repeated measures or matched pairs design
  • Spearman’s Rho is for correlations
  • Chi-Squared is for analysing independent variables in categories (eg most observations)
 
The Edexcel exam might ask you about the appropriateness of a particular statistical test.
Picture
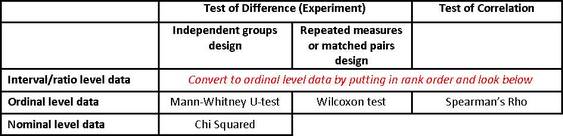
To work out which test to use, you need to understand research design and also levels of data, which are described below.
Picture

LEVELS OF DATA IN PSYCHOLOGY
INTERVAL & RATIO, ORDINAL, NOMINAL

There are four levels of data collection: the highest (ratio level) is the most specific, the lowest (nominal level) is the most basic.

RATIO LEVEL DATA

Ratio level data is a score on a scale, such as a test score. The crucial thing about ratio level data is that there is a meaningful score of zero which means “no data”. For example, you can score 0 on a memory test if you recalled no objects, but a temperature of 0 degrees Centigrade doesn’t mean there is no heat. This idea of “absolute zero” gives ratio level data a starting point.

INTERVAL LEVEL DATA

Interval level data is also a score on a scale, but the scale doesn’t have an “absolute zero”. This might mean you can go into negative figures on this scale because even if the number "0" occurs on the scale, you could in theory go lower. Temperature in degrees Centrigrade is like this: "0" is just a number on the scale but it's not the lowest possible number. This means interval level data doesn’t have a fixed starting point.
Picture
For this Psychology course, I will lump ratio and interval level data together and call them interval/ratio level data. Interval/ratio data is any score that exists on a scale, whether the scale has an absolute zero or not.

ORDINAL LEVEL DATA

Ordinal level data is also a number score, but the number represents rank position: 1st, 2nd, 3rd, etc. The positions of football teams in a league are examples of ordinal data. You can turn interval/ratio data into ordinal data by putting everybody’s scores into rank order.
 
Most statistical tests use ordinal data but more psychological measures gather interval/ratio level data, so you will probably have to rank order your scores before you carry out your statistical test.
 
Rank ordering is fiddly. You give a rank of 1 to the highest score, 2 to the second highest, and so on. If participants share the same score they have to share the same rank; award them the middle rank of the ones they occupy, so if 3 participants share 2nd, 3rd and 4th place, they all get rank 3 and the next participant down gets rank 5.
Picture
In this example, animated films have ratio level data (because a film could earn $0 in theory, if no one paid to see it) but they’ve been put in rank order: Frozen is 1 and Toy Story 3 is 2. One of the things ordinal level data does is obliterate the distinctions between the objects being ranked: Toy Story 3 is pretty close behind Frozen but The Lion King lags some way behind, but you’d never know that from their ranks of 1, 2 and 3 alone.

NOMINAL LEVEL DATA

Nominal level data doesn’t give scores to participants; it puts them in categories, which is why it’s sometimes called categorical data. The most common example of this is using “tally marks” to record the number of people in one group or another.
Picture
Nominal level data produces frequencies (the number of times a particular category is observed) and is easily turned into percentages.

For example, if you surveyed people about their favourite pet, you'd get tallies in each category. These frequencies could be used to make a pie chart.
Picture
Interval/ratio level data can be turned into nominal level data by putting it into a frequency table. Typically, you would create categories based on scores and tally the number of participants who got a score in that category. This is how you would create a histogram from interval/ratio level data.
Picture
IQ is a good example of ratio level data (because you could get a score of 0 if you answered no questions correctly). Here it has been converted to nominal level data by putting everyone into categories (84.6-89.5 has 5 people in it, 89.6-94.5 has 10).

You can see how hard it would be to scale back up to interval/ratio level data afterwards, because everyone’s individual IQ score got lost in the conversion: they’re just categories now.
Picture
Although you can “dial down” your level of data, turning interval/ratio into ordinal or interval/ratio into nominal, you can’t “dial up”. With nominal level data, individuals just become tally marks in boxes and they all look the same: you can’t identify a particular participant and work out how they were different from anybody else in the same category.
Picture

PERFORMING INFERENTIAL STATISTICAL TESTS
HOW TO DO THE FORMULAE

Each inferential test has its own page:
Mann-Whitney U Test
Wilcoxon Test
Spearman's Rho test
Chi-Squared test
However, there is a basic procedure they all follow.

CALCULATED YOUR OBSERVED VALUE

Every inferential test involves calculating a number known as the observed value. Each test has its own codename for this value:

  • The Mann-Whitney U-test calls it U
  • Wilcoxon test calls it T
  • Chi-Squared test calls it chi-squared or X2
  • Spearman’s Rho calls it rho or r
 
In the first two tests, you are looking for your observed value to be as small as possible, but in Chi Squared and Spearman’s Rho you want it to be as large as possible.

CHOOSE YOUR PROBABILITY LEVEL

Inferential tests work out how likely or unlikely your results are.

  • If your results are very unlikely, then you can refute your null hypothesis and accept your alternative hypothesis; unlikely results suggest that there is a pattern or trend at work
  • If your results are relatively normal, you accept your null hypothesis and refute your alternative hypothesis; any apparent pattern will be down to random variations and doesn’t mean anything
 
The big question is, How unlikely do results have to be before you take them seriously and treat them as a pattern?
 
This decision is summed up in a value known as p (for probability). p expresses how unlikely the results have to be before you will treat them as a pattern.
The ≤ symbol means "equal to or less than" so p≤0.05 means the probability that random variations are at work is equal to or less than 0.05.

0.05 is a way of referring to percentages:
0.5 is 50%
0.1 is 10%
0.05 is 5%

So p
≤0.05 means the probability that random variations are at work is 5% or less.

p≤0.5
This is a 50% chance the results are down to random variation. This is a silly level of probability; it doesn’t prove anything. Would you drive over a bridge that was 50% safe? Would you take a drug that only had a 50% chance of killing you? Of course not. So p≤0.5 is almost the same as saying the results are down to dumb luck.

p≤0.1
This is a 10% chance the results are down to random variation. This is better, but it still doesn’t prove much. I still wouldn’t use a bridge or take a drug that was only 90% safe to use. I wouldn’t be inclined to put too much trust in a study that was only 90% likely to be true.

p≤0.05
This is a 5% chance the results are down to random variation. That’s still not amazing, but it’s starting to mean something. 95% trustworthiness is considered “good enough” for a lot of classroom research. Your own practicals will test their hypotheses at p≤0.05 level of probability and if the results are significant at this level then you "fail to reject the null hypothesis" as they say. However, professional researchers will usually aim for something better.
Picture
p≤0.05 is the standard level of probability (p) for student research.
p≤0.01
This is a 1% chance that the results are down to random variation. Personally, I still wouldn’t be comfortable on a bridge or an aeroplane that was only 99% safe to use, but this is a pretty impressive level of probability for student research. If you test your hypothesis at p≤001 and you still refute the null hypothesis, then you’re probably on to something.

p≤0.001
Now this is the big league: only a 0.1% chance that the results are down to random variations. This is the sort of level of probability that manufacturers use when they declare their products are “safe” for the public, because of course nothing is truly “safe” so “safe” just means it’s really unlikely the product will damage you. If you test your hypothesis at this level and you still refute the null hypothesis, you’ve discovered a striking pattern or trend that is 99.9% likely to be true. To test at this level, you need a really large sample, so it’s not used by most students when testing the hypotheses in practicals.

FIND YOUR CRITICAL VALUE, PART 1

Once you have calculated your observed value and you’ve selected a value for p (most likely p≤0.05 which is a 5% chance or less that the results are down to random variations), you can consult a critical value table.
 
Each statistical test has its own critical value table and there are different tables for directional (1-tailed) and non-directional (2-tailed) hypotheses as well as different tables for different values of p. But once you’ve found the right table, there’s one more thing you need to know…

YOUR VALUE OF n OR df

It makes a big difference how many scores you’re comparing. If you’ve got a huge sample, it’s much easier to see patterns. n or df are scores that represent the size of your sample.

  • n stands for the number of participants in each condition. In independent groups design, you might have more people in one condition than the other; you might have na (the number of people in Condition A) and nb (the number in Condition B)
  • One of the nice things about Wilcoxon’s test is that it’s for repeated measures or matched pairs designs, where there’s always the same number of people in each condition. This makes it a much simpler critical values table
  • Chi-Squared is for nominal data where the number of participants doesn’t matter; what matters is the number of categories. This is expressed by the phrase degrees of freedom or df. The more degrees of freedom, the more catergories you are comparing. There's a simple little formula for working out df.

FIND YOUR CRITICAL VALUE, PART 2

Count down and/or along the table until you find your value of n or df. You will find the critical value there.

You will compare your observed value to your critical value to see if your results are statistically significant.

If they are significant, you have found a pattern and you can refute your null hypothesis and accept your alternative hypothesis. With insignificant results, you must accept your null hypothesis.
 
  • In a Mann-Whitney U-test, if U is equal to or less than the critical value, your difference is statistically significant
  • In a Wilcoxon test, if T is equal to or less than the critical value, your difference is statistically significant
  • In a Chi-Squared test, if X2 is equal to or greater than the critical value, your difference is statistically significant
  • In a Spearman’s Rho test, if r is greater than the critical value, your correlation is statistically significant
Picture

WHAT IF I WANT TO TEST MORE THAN TWO VARIABLES?

Maybe you have more than 2 variables to test. For example:
  • Bandura et al. (1963) compared the live model condition to the filmed model and the animated character model; that’s 3 conditions
  • Burger (2008) compared the base condition with the model refusal condition and Milgram’s Variation #5 results; 3 conditions

There are fancy computer programs that will do this for you. But otherwise, you will just have to do each comparison with its own separate inferential test:
  • Compare/correlate Condition/variable A with Condition/variable B
  • Then B with C
  • Then C with A

It takes a while, but you’ll be a better person at the end.
Home
Blog
Contact

PSYCHOLOGYWIZARD.NET
  • Home
  • Unit 1 FOUNDATIONS
    • Biological >
      • Adoption & Twin Studies AO1 AO2 AO3 >
        • Gottesman & Shields AO1 AO3
        • Kety AO1 AO3
      • Aggression AO1 AO2 AO3 >
        • Evolutionary Psychology AO1 AO2 AO3
      • The Brain AO1 AO2 >
        • Drugs & the Brain AO1 AO2 AO3
      • Brendgen AO1 AO3
      • Development (Maturation) AO1 AO2 AO3
      • Freud's Psychodynamic Theory AO1 AO3 >
        • Aggression & Freud AO1 AO2 AO3
        • Development & Freud AO1 AO2 AO3
        • Individual Differences & Freud AO1 AO2 AO3
      • Raine AO1 AO3
      • Biological Key Question AO1 AO2
    • Cognitive >
      • Baddeley AO1 AO3
      • Multi Store Model AO1 AO2 AO3
      • Reconstructive Memory AO1 AO2 AO3
      • Schmolck AO1 AO3
      • Tulving's Long Term Memory AO1 AO2 AO3
      • Working Memory AO1 AO2 AO3
      • Cognitive Key Question AO1 AO2
    • Learning >
      • Bandura AO1 >
        • Bandura AO3
      • Becker AO1 AO3
      • Classical Conditioning AO1 AO2 AO3
      • Operant Conditioning AO1 AO2 AO3
      • Pavlov AO1 AO3
      • Social Learning AO1 AO2 AO3
      • Therapies for Phobias >
        • Flooding
        • Systematic Desensitisation
      • Watson & Rayner AO1 AO3
      • Learning Key Question AO1 AO2
    • Social >
      • Agency Theory AO1 AO2 AO3
      • Burger AO1 AO3
      • Situational Factors AO1 AO2 AO3
      • Milgram AO1 >
        • Milgram AO3
      • Realistic Conflict Theory AO1 AO2 AO3
      • Sherif AO1 >
        • Sherif AO3
      • Social Impact Theory AO1 AO2 AO3
      • Social Identity Theory AO1 AO2 AO3
      • Social Key Question AO1 AO2
  • Unit 2 APPLICATIONS
    • Clinical >
      • Depression AO1 AO2 >
        • Biological Explanation AO1 AO2
        • Non-Biological Explanation AO1 AO2
        • Biological Treatment AO1 AO2
        • Psychological Treatment AO1 AO2
      • Diagnosing Abnormality AO1 AO2 AO3
      • Diagnostic Manuals AO1 AO2 AO3
      • Carlsson AO1 AO3
      • Kroenke AO1 AO3
      • HCPC Guidelines AO1 AO2 AO3
      • Rosenhan AO1 AO3
      • Schizophrenia AO1 AO2 >
        • Biological Explanation AO1 AO2
        • Non-biological Explanation AO1 AO2
        • Biological Treatments AO1 AO2
        • Psychological Treatment AO1 AO2
      • Clinical Key Question AO1 AO2
      • Issues & Debates >
        • Social Control AO2 AO3
  • Evaluation
    • Ethics AO1 AO2 AO3
    • Individual Differences AO1 AO2 AO3 >
      • Brain Differences AO1 AO2 AO3 >
        • Personality AO1 AO2 AO3
      • Mental Health Differences AO1 AO2 AO3
      • Differences in Obedience & Prejudice AO1 AO2 AO3
      • Memory Differences AO1 AO2 AO3 >
        • Loftus study AO1 AO2 AO3
    • Nature vs Nurture AO1 AO2 AO3
    • Scientific Status AO1 AO2
  • Methods
    • Animal Studies AO1 AO2 AO3
    • Case Studies AO1 AO2 AO3 >
      • Bradshaw AO1 AO3
      • Scoville & Milner AO1 AO3
    • Content Analyses AO1 AO2 AO3
    • Experimental Method AO1 AO2 AO3
    • Experimental Variables AO1 AO2
    • Hypotheses AO1 AO2
    • Inferential Statistics AO1 AO2 >
      • Chi-Squared Test AO1 AO2
      • Mann-Whitney U Test AO1 AO2
      • Spearman's Rho AO1 AO2
      • Wilcoxon Test AO1 AO2
    • Longitudinal Design AO1 AO2 AO3
    • Quantitative Data & Analysis AO1 AO2 AO3
    • Research Design AO1 AO2 AO3
    • Sampling AO1 AO2 AO3
    • Self Report Method AO1 AO2 AO3 >
      • Brown et al. AO1 AO3
  • Blog
  • Contact
  • Resources